“How do I know which e-commerce metrics to pay the most attention to?” is a question that marketers repeatedly ask themselves.
In this blog post, we’ll look at some of the essential e-commerce metrics for 2024 and discuss how they can help you succeed in the online marketplace. Stay tuned!
What are e-commerce metrics, and why do they matter?
An e-commerce metric is a set of numbers that indicate how well your online store is doing.
Tracking metrics regularly helps you detect areas for improvement and make more informed decisions. These metrics can, in turn, give you a complete picture of your store’s performance – from the number of sales to the average value of all purchases.
Simply put, with this knowledge, you’ll have a better idea of where to start strategizing for success.
And remember, data is the only way to determine marketing performance. Without it, you can’t test different hypotheses.
How often should I monitor my e-commerce metrics?
The simple answer is “regularly,” but there’s no definitive one.
- Weekly: if you’re just starting, it’s best to track metrics every seven days because you’ll be able to see your store growing. However, the downside is that doing it too often will be time-consuming and might produce a data overload.
- Monthly: this is the sweet spot for tracking e-commerce metrics. It provides enough time for meaningful changes, but not so much that you’ll lose sight of your overall progress.
- Quarterly: if you feel like you have a handle on things and don’t need to perform tracking as frequently, every three months might be a good option for you. Just be sure to revisit your metrics more often if things go downhill.
However, the time between each check will vary depending on many factors.
For example, if you’ve just made changes to your website or launched a new marketing campaign, then it’s sensible to track metrics more frequently to see whether or not the changes are making a difference.
In contrast, if your online store has been running smoothly for a while, you might only need to check the data every few weeks or months.
The most critical metrics for your e-commerce business in 2024
There are several different factors to consider when measuring the success of a company’s e-commerce operation. By understanding which metrics matter most to your business, you can develop a plan to improve those metrics and see a significant increase in revenue.
Which ones should you be paying attention to in 2024?
Website metrics
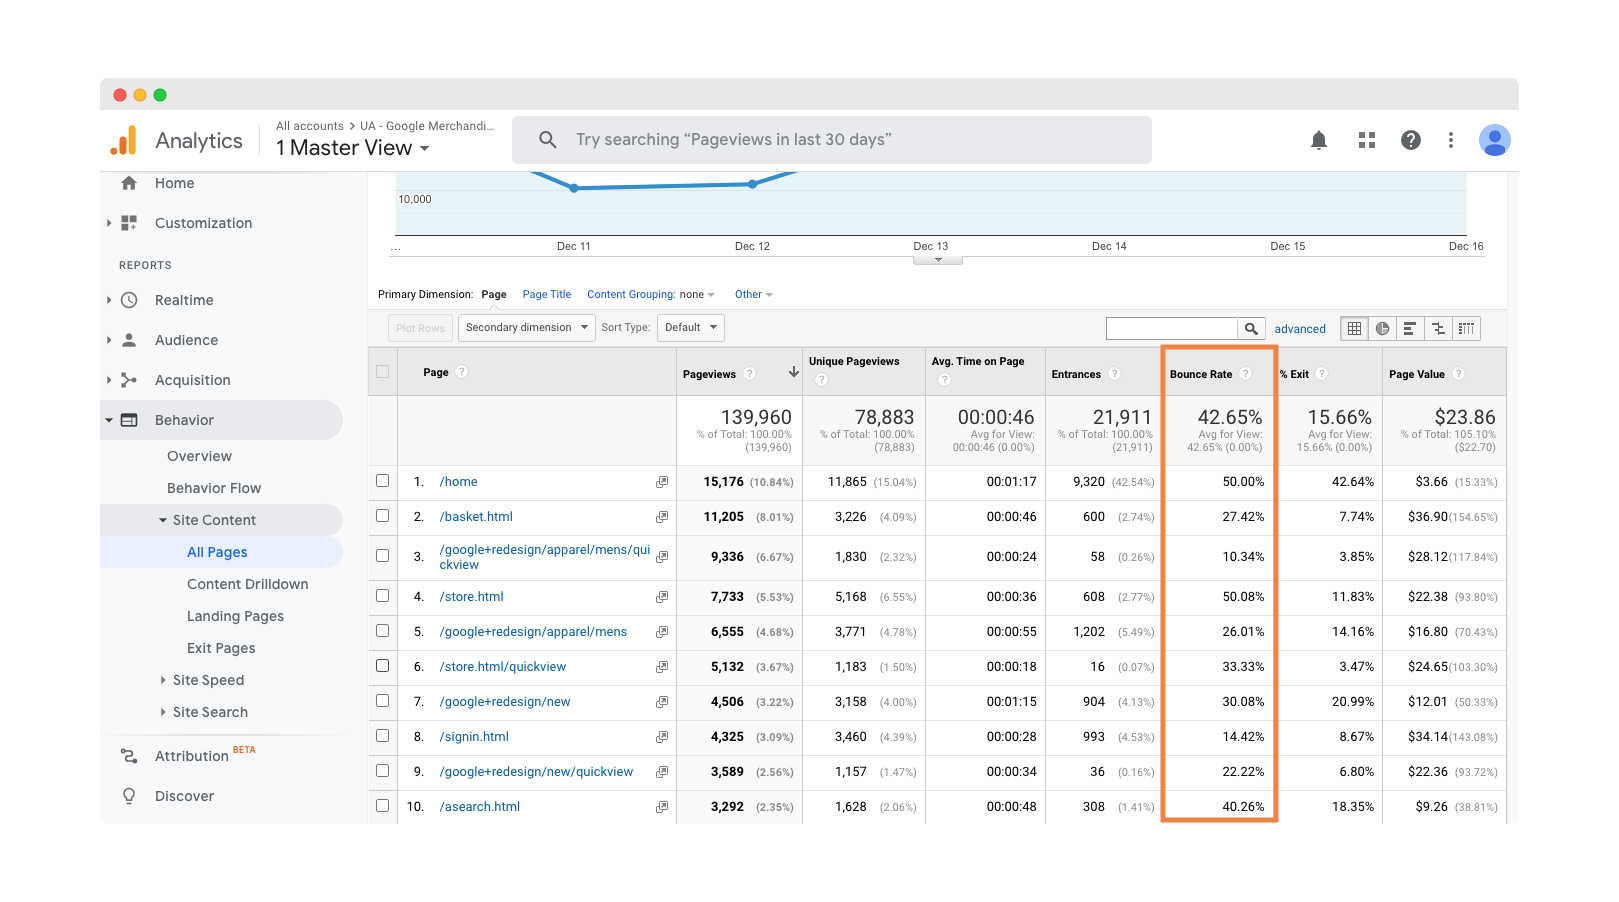
1. Bounce rate
The bounce rate is perhaps the most popular and frequently used statistic in e-commerce. This figure quantifies what percentage of visitors left your site without viewing any other pages besides that which was first landed on.
A high bounce rate indicates significant UX issues such as site navigation difficulties or overly long page loading times. However, this can also be a sign of poor targeting, meaning that people can’t find what they’re looking for on your site.
How to track it?
View the bounce rate in Google Analytics by going to Behavior ➞ Site Content ➞ All Pages.
2. Pages per session
This indicator reveals the average number of pages viewed by visitors during a single session.
The lower the number, the less interested visitors are. If the number is high, it suggests that customers are either well-informed or know precisely what they are looking for.
How to track it?
You can track pages per session in the Acquisition Overview report in Google Analytics.
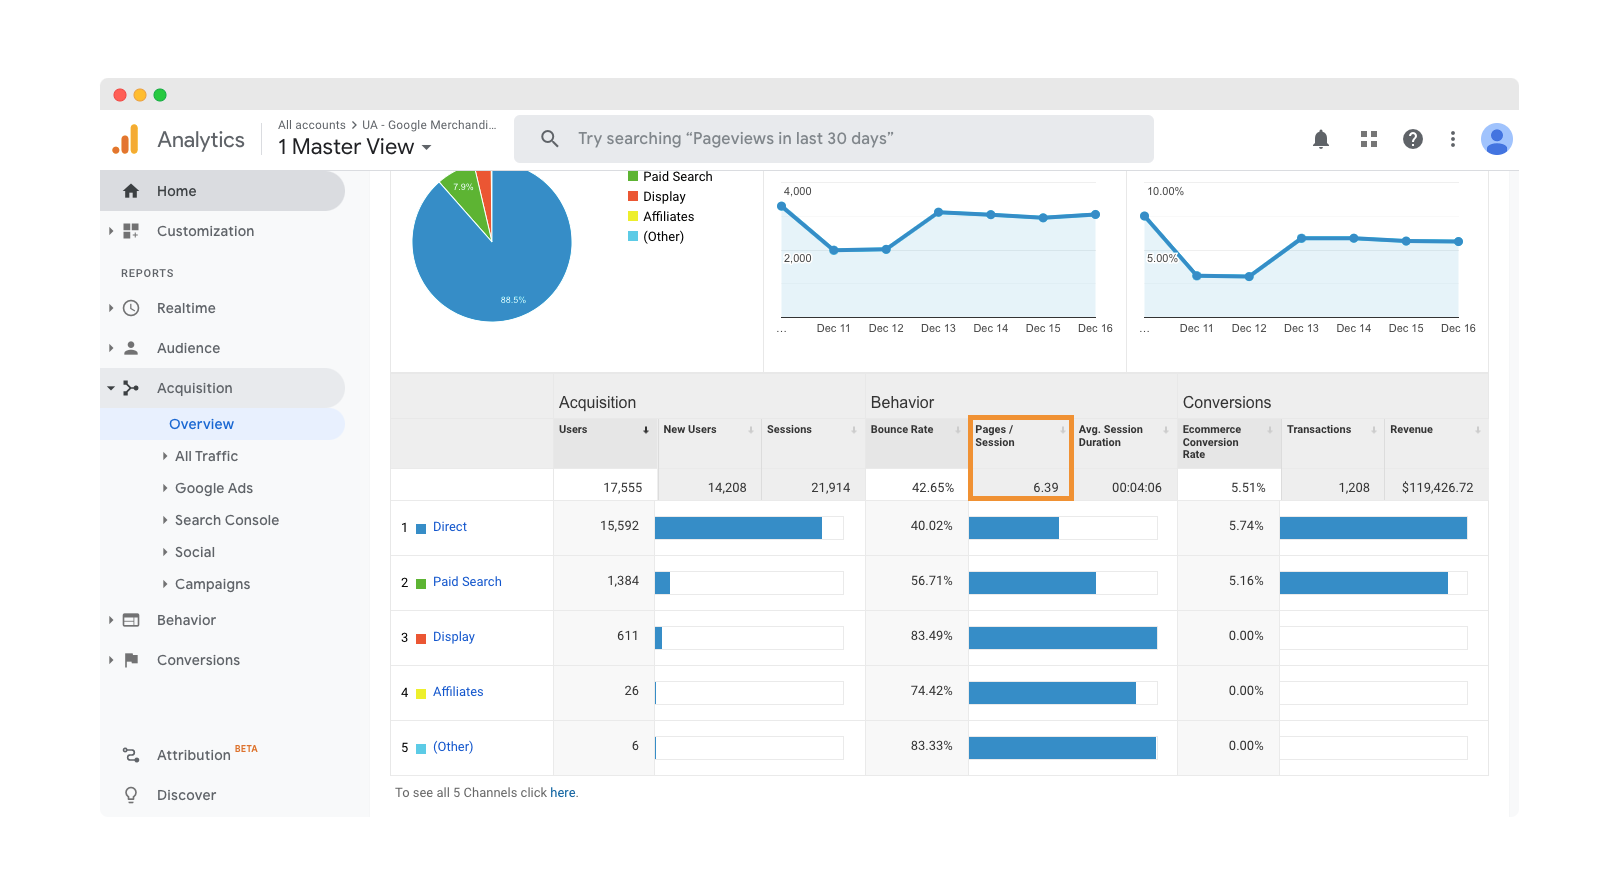
Want to dig deeper into this metric? You can also view the average number of pages per session by channel, source, medium, and referral. Doing so lets you figure out what traffic sources lead to the most engagement.
3. Site speed
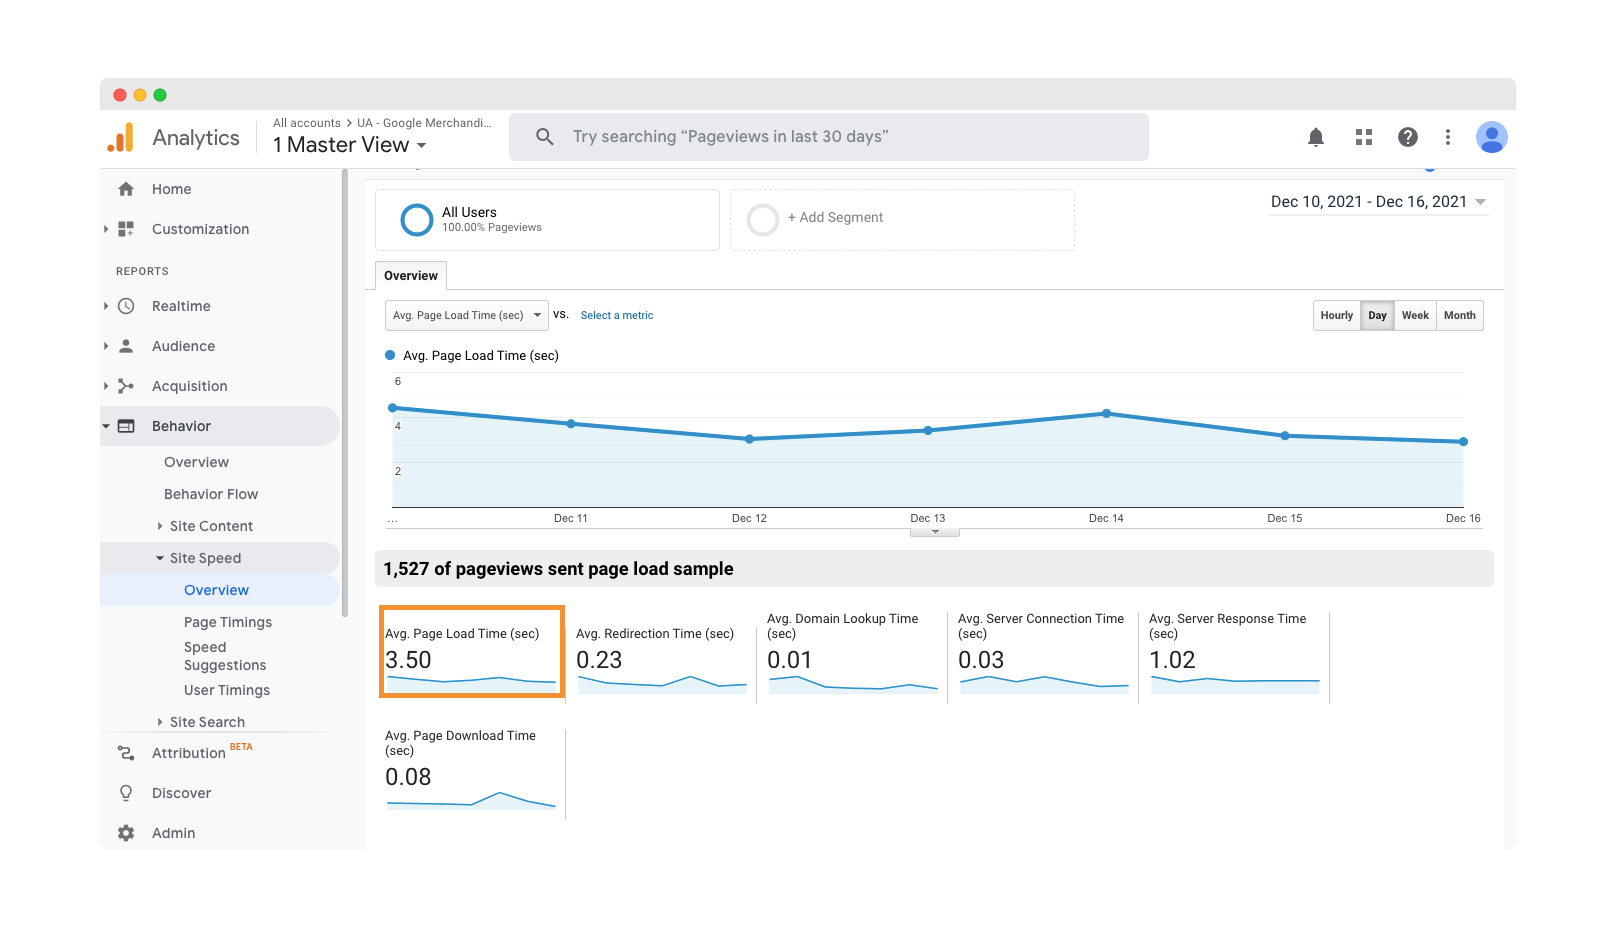
This metric measures how quickly your pages are loading. A fast-loading site is essential for keeping customers engaged and preventing them from abandoning your store.
The optimal loading time for an e-commerce site is no more than 2 seconds. If your page load time is too long, try reducing the size of your images and files, as well as optimizing other elements on your site.
How to track it?
There are many options for checking your site speed. One of them is in Google Analytics by clicking Behavior ➞ Site Speed ➞ Overview.
You could also try tools like PageSpeed Insights or GTmetrix to test your site speed.
4. Device type
Providing customers with the perfect experience is vital in 2024, especially on mobile devices.
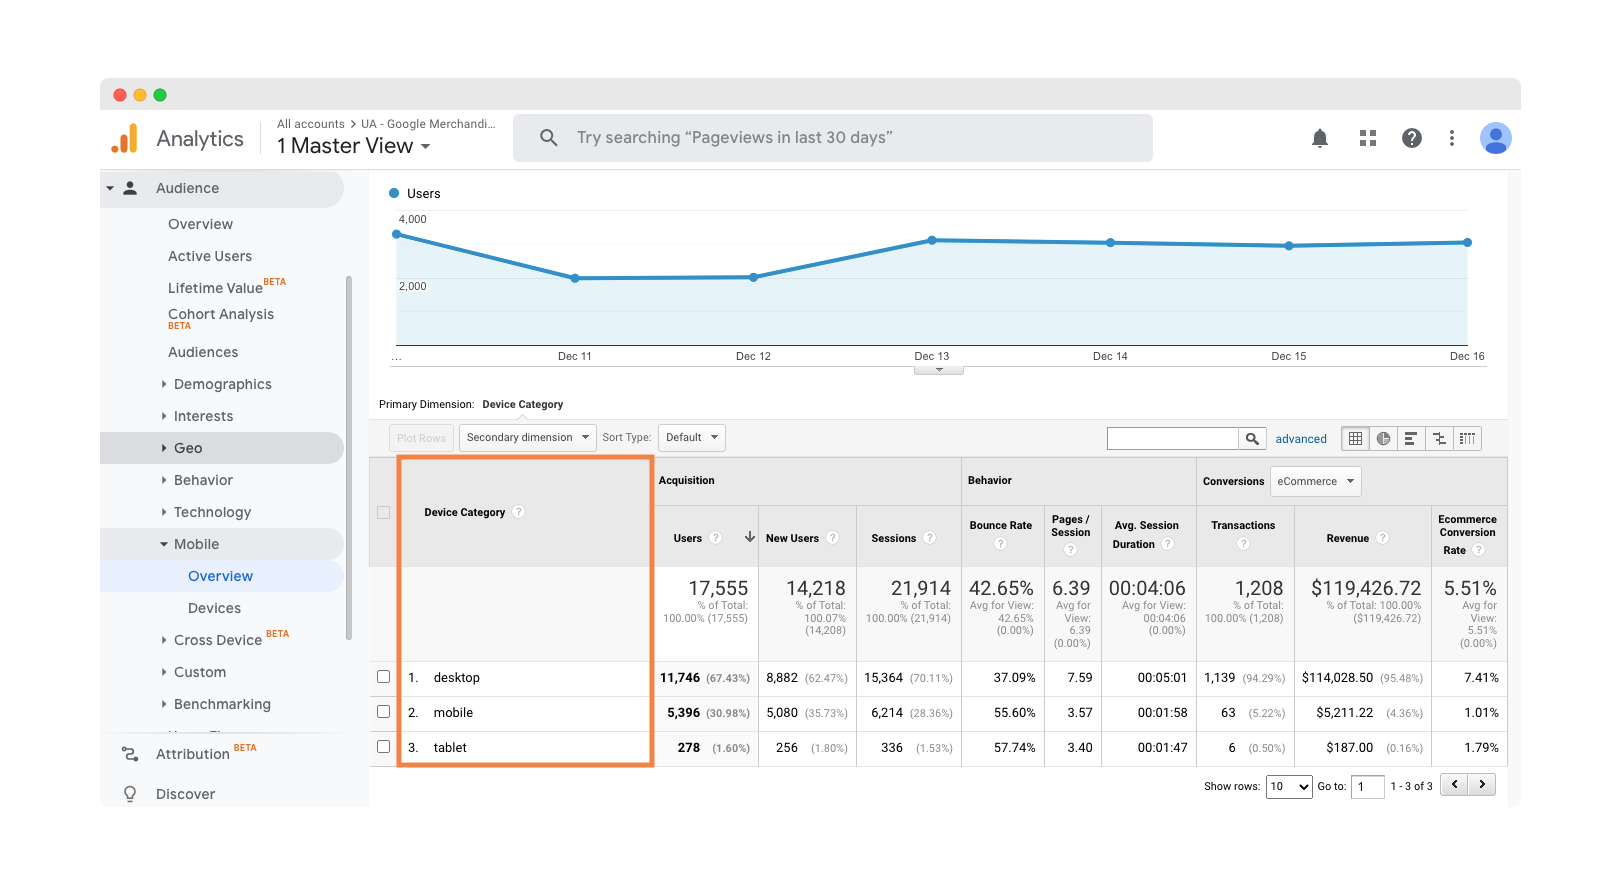
The device type metric tells you about the technologies your visitors are using. You can use it to tailor your UX design to be compatible with the most popular devices or check which ones your visitors use most often.
You should maintain consistency in the user experience across all types of devices. Testing mobile, web, and tablet performance will help you better understand how customers shop and what works best.
How to track it?
You can use Google Analytics and go to Audience ➞ Mobile ➞ Overview to see data on device types.
Business metrics
5. Average order value (AOV)
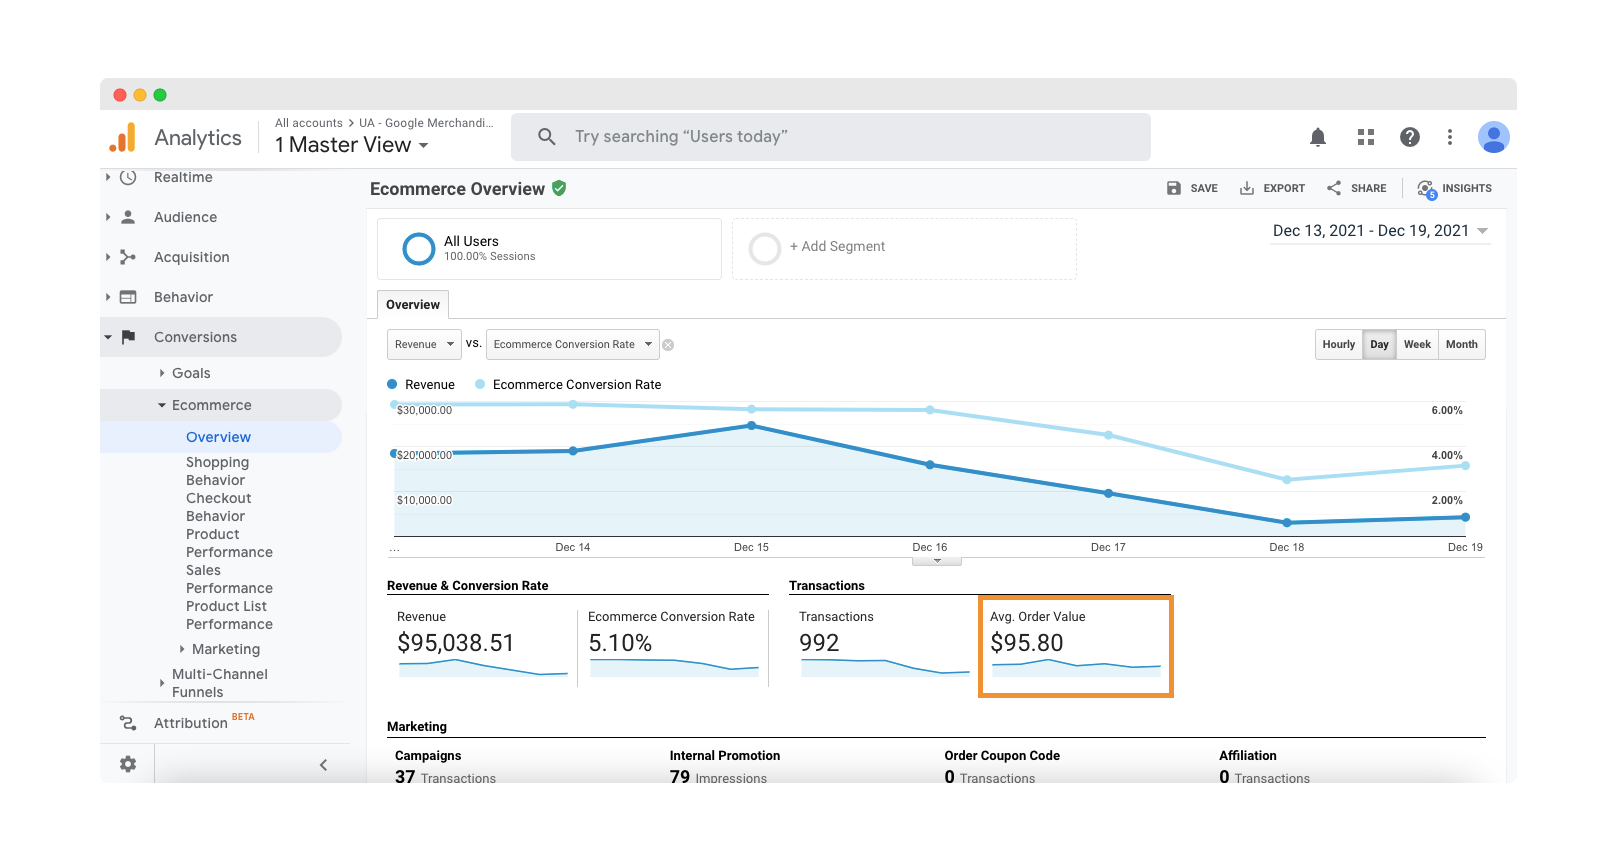
Do you want to know the average amount of money each customer spends on your site? You can find that out with this metric.
As well as letting you know if you make enough money from each customer will help you identify which products are most popular.
How to track it?
If you want to check your AOV, go to Google Analytics and click on Conversions ➞ Ecommerce ➞ Overview.
6. Customer retention rate
This metric measures how many of your customers are returning to your site. It shows how successfully you retain customers once you have initially converted them.
A high retention rate is a good sign of providing valuable content and services that keep customers returning.
If your retention rate is low, consider adding new products or services to your site regularly and hook them up with a loyalty program or give discounts for the next order, for example.
What’s a reasonable customer retention rate? This metric varies depending on the industry. For example, e-commerce and SaaS companies tend to have a retention rate of around 35%.
How to track it?
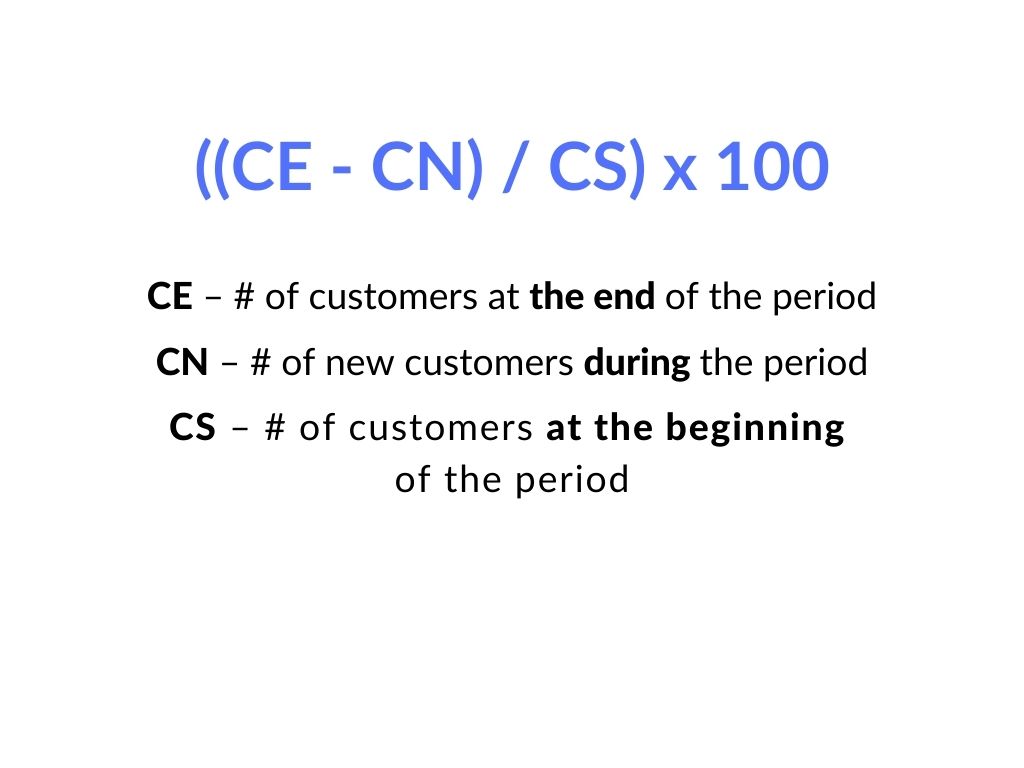
The retention rate is a tricky one. You can’t simply check it in Google Analytics, so you have to calculate it manually (with e.g., Google Sheets or Excel help) by using the following formula:
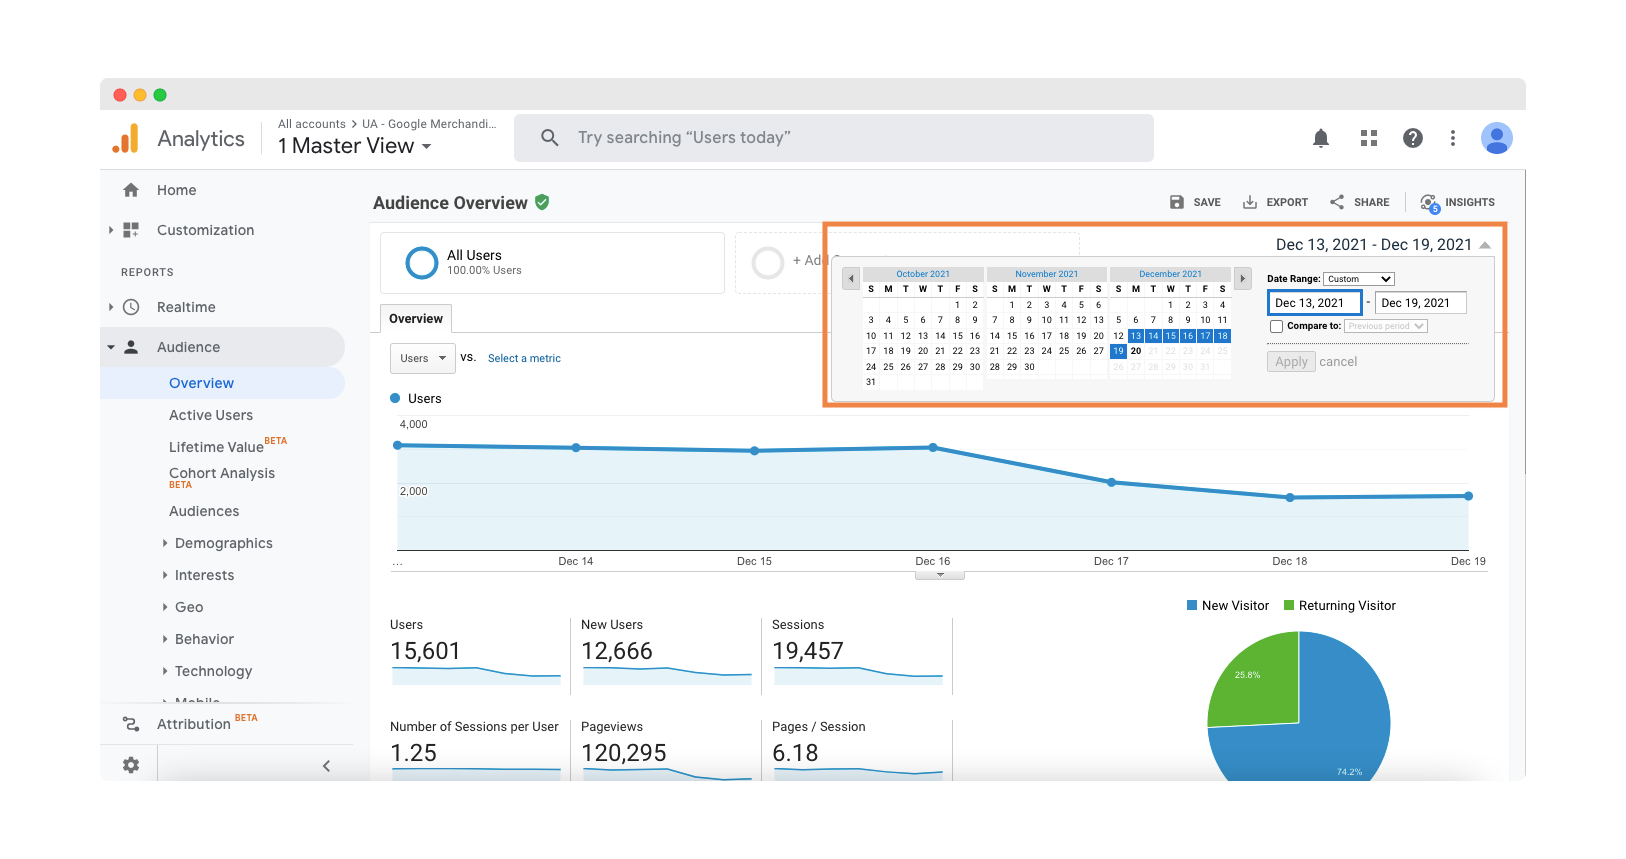
The relevant customer data can be viewed by selecting Audience Overview in Google Analytics and filtering the results by the period you wish to analyze.
7. Shopping cart abandonment rate
Rather self-explanatory, this is the percentage of shoppers who place an item in their basket but never complete the purchase process.
Marketing automation strategies allow e-commerce stores to recover almost one-third of abandoned carts. Such methods include sending shoppers emails about the items left in their carts with an invitation to complete their purchase and providing additional incentives for them, like a discount coupon or free shipping.
How to track it?
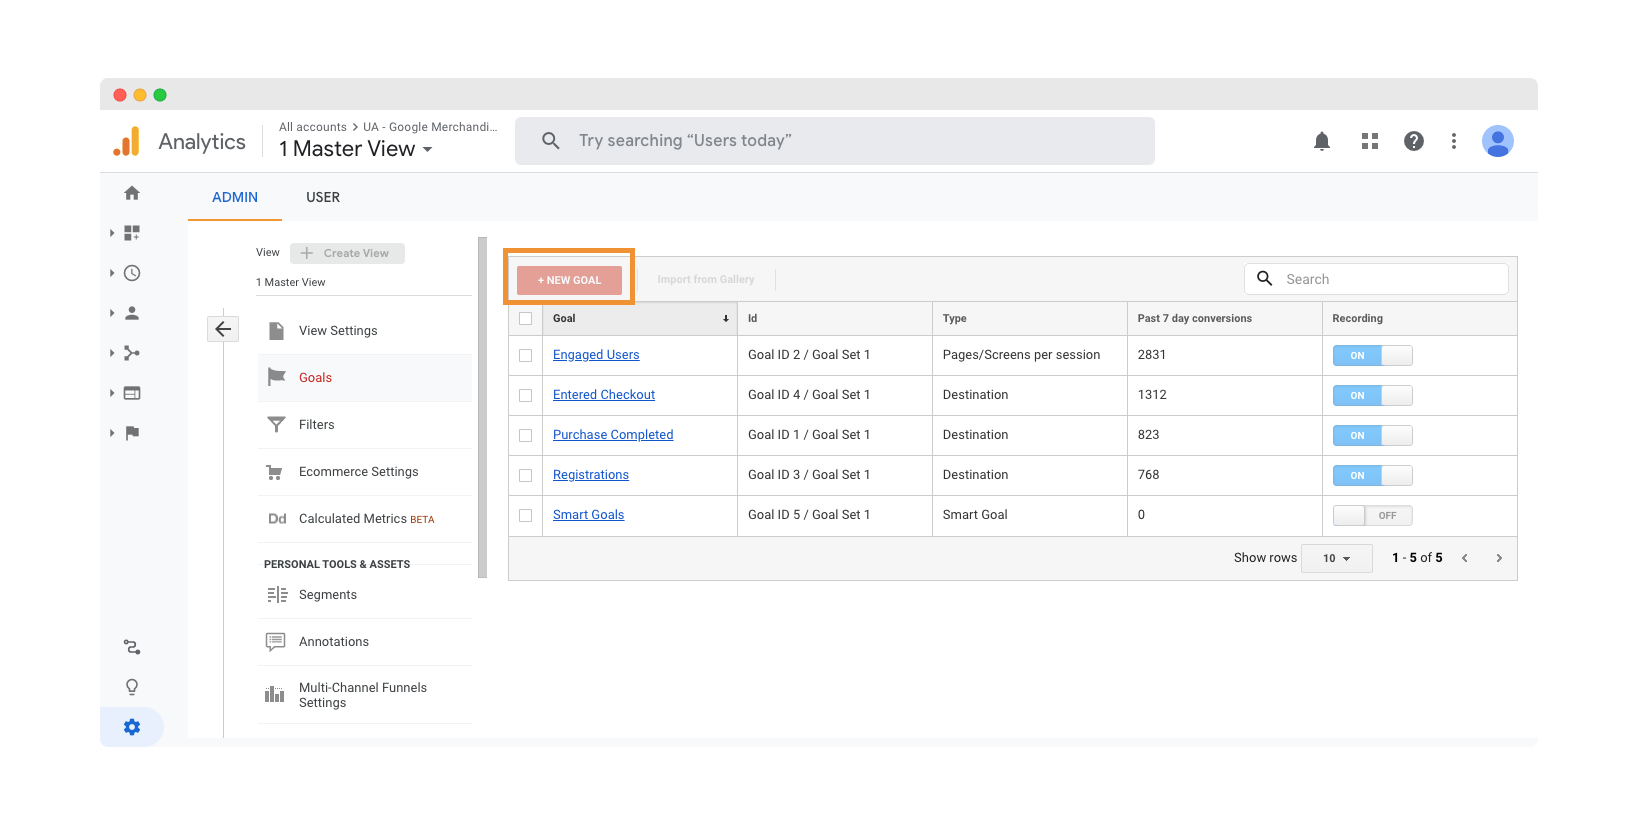
Setting up a goal is the easiest way to track the abandonment rate in Google Analytics. You have to go to Admin, click Goals under View and create a New plan (note that it takes up to 24 hours to see current data).
8. Checkout abandonment rate
The checkout abandonment rate goes further along the purchase process than the equivalent for shopping carts. The former is the percentage of people who start the checkout process but never complete it.
As with the shopping cart metric, a high checkout abandonment rate signals some issues with the complexity of the process. It would help if you reduced these as much as possible.
How can this metric be improved?
- Try to streamline your checkout process – autofill, guest orders, and countdown stages.
- Use social media retargeting.
- Be transparent about all costs (e.g., taxes, shipping) upfront.
How to track it?
You can track this metric in Google Analytics by creating a new goal and monitoring how people complete the checkout process at each stage.
9. Average shopper dwell time
This metric measures how long customers spend on each page of your site.
A high dwell time could indicate that customers are interested in what they see, but it may also suggest that distractions like ads or navigation menus should be reduced. Use this data to identify which pages need the most attention.
How to track it?
With Google Analytics, you can determine the dwell time by checking the Average Session Duration metric. Go to Behavior ➞ Site Content ➞ All pages.

10. Average ticket resolution time
How long it generally takes your customer service team to resolve tickets reflects its efficiency.
Many businesses tend to focus on having a quick first response time but forget about the most important thing, which is the final resolution of a client’s concerns. Your customer experience will be negatively affected if you delay answering questions for too long.
A high ticket resolution time could indicate that you need more staff or that your customer service needs some improvement.
How to track it?
Make sure that resolved tickets mean resolved issues by closely monitoring your system. The metric can be tracked in Google Analytics, but it must be integrated with your customer service solution, such as Zendesk.
Sales metrics
11. Sales conversion rate
This is one of the essential e-commerce metrics, tracking your store’s success at convincing visitors to buy products.
This metric can measure the effectiveness of different marketing campaigns or, in the case of subscription-based e-commerce sites, what percentage of leads become paying customers.
How to track it?
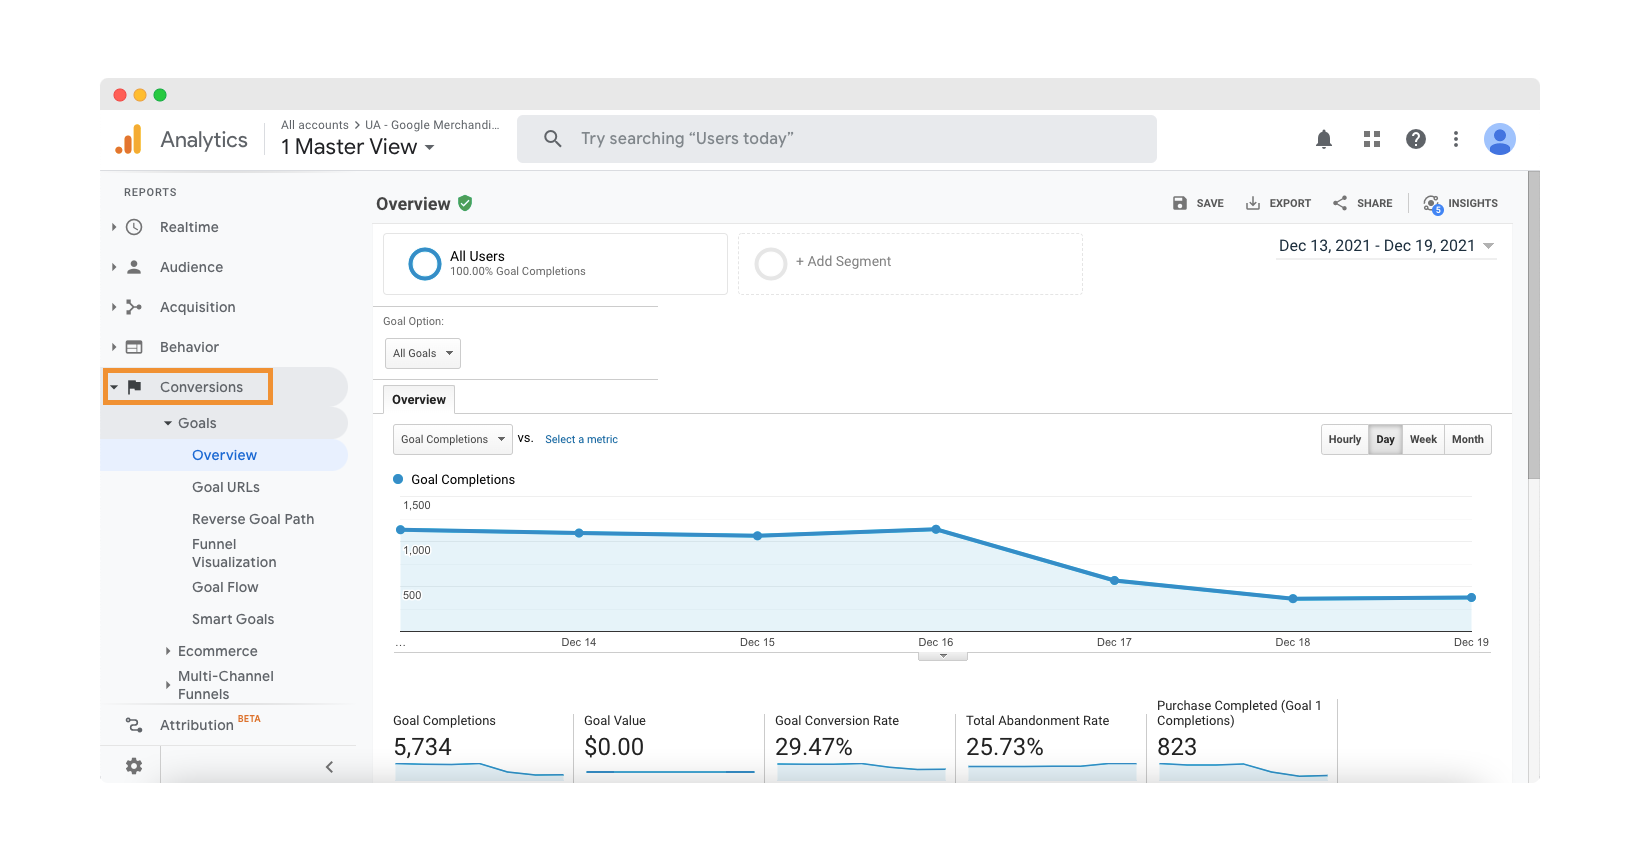
To see your conversions overview go to Conversions ➞ Goals. If you want to analyze further, click on Conversions ➞ E-commerce.
12. Customer Lifetime Value (LTV)
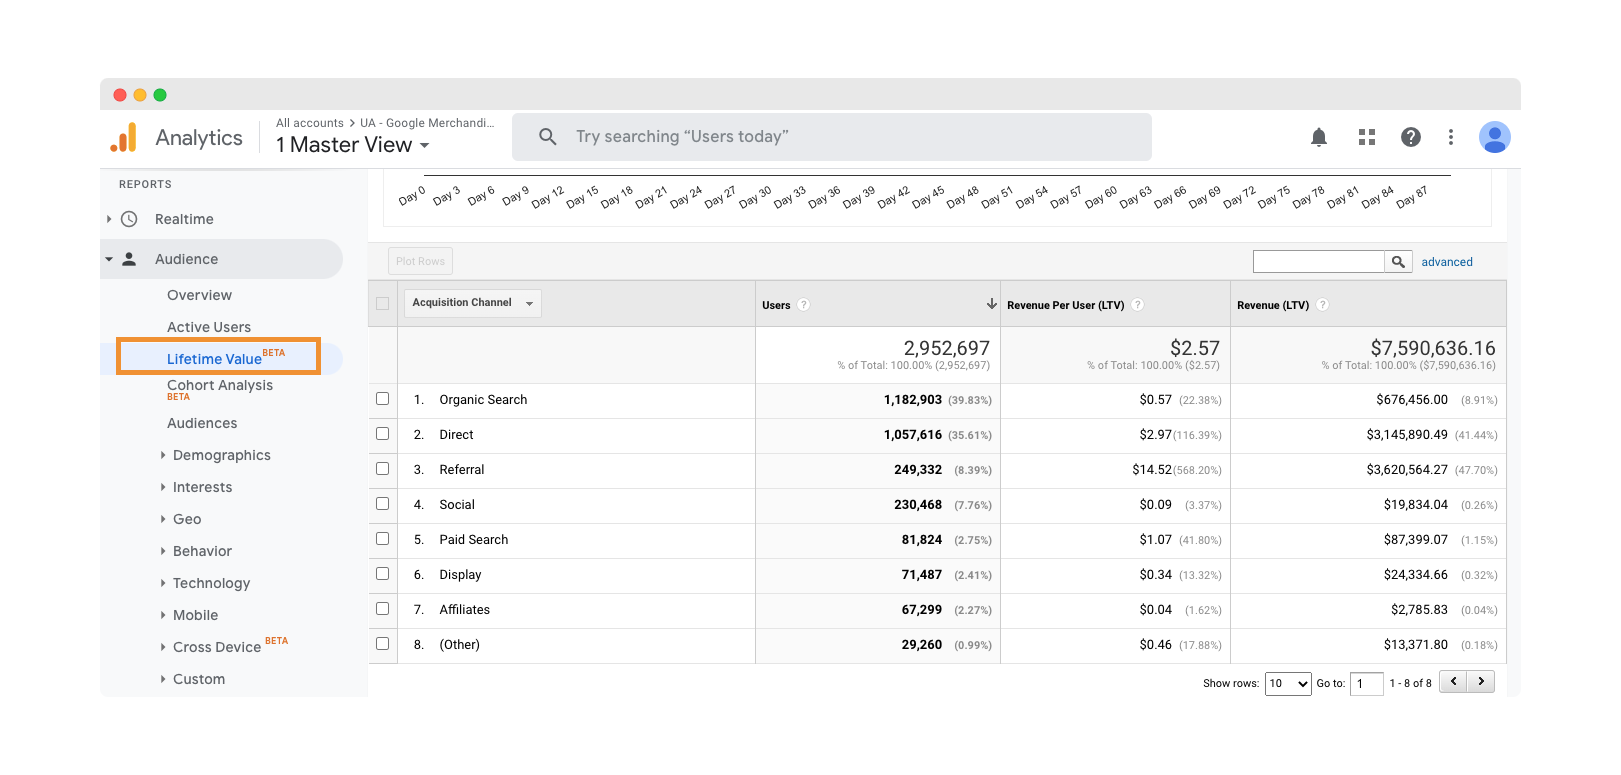
Customer lifetime value is how much a customer is worth to a business over the whole relationship period. With lifetime value, you can see how many users you acquired through emails or paid searches.
To maximize revenue, e-commerce businesses should consider this metric when determining how much to spend and how long it takes to convert a potential client into a paying customer.
How to track it?
In Google Analytics, LTV is still in testing mode. Go to Audience ➞ Lifetime Value to check how it works.
13. Gross margin
This is simply sales revenue minus the cost of products, materials, and goods sold.
By monitoring margin values on an ongoing basis, it will be easier for you to decide whether or not to reinvest profits for growth in the New Year. Comparing this to other benchmarks will provide insights into your growth’s sustainability.
How to track it?
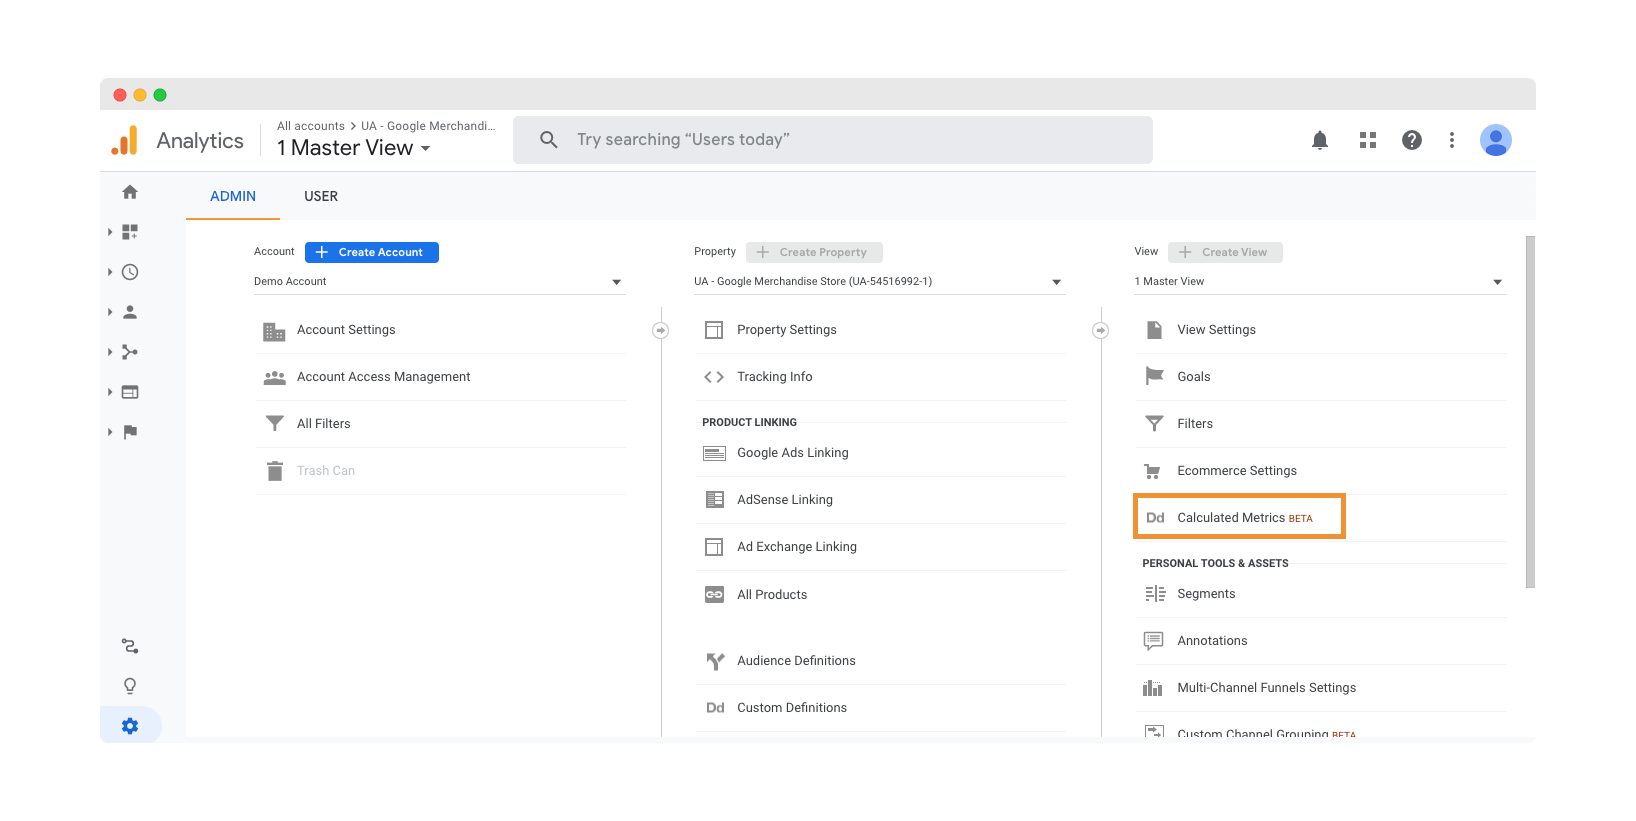
In Google Analytics, select Admin, and find Calculated Metrics under View. Create a new metric to view this info whenever you want.
14. Cost per Acquisition (CPA)
In other words, it’s the amount of money a company spends on gaining a new customer.
CPA is calculated by dividing the total amount of money spent on advertising and marketing in a given time frame, both online and offline, by the number of new customers acquired during that period.
The average CPA for companies within different industries varies depending on their operating sector. For example, retailers can have an average CPA of $30-$50 per customer, while for non-profit organizations, it might be as high as $500-$1,000.
How to track it?
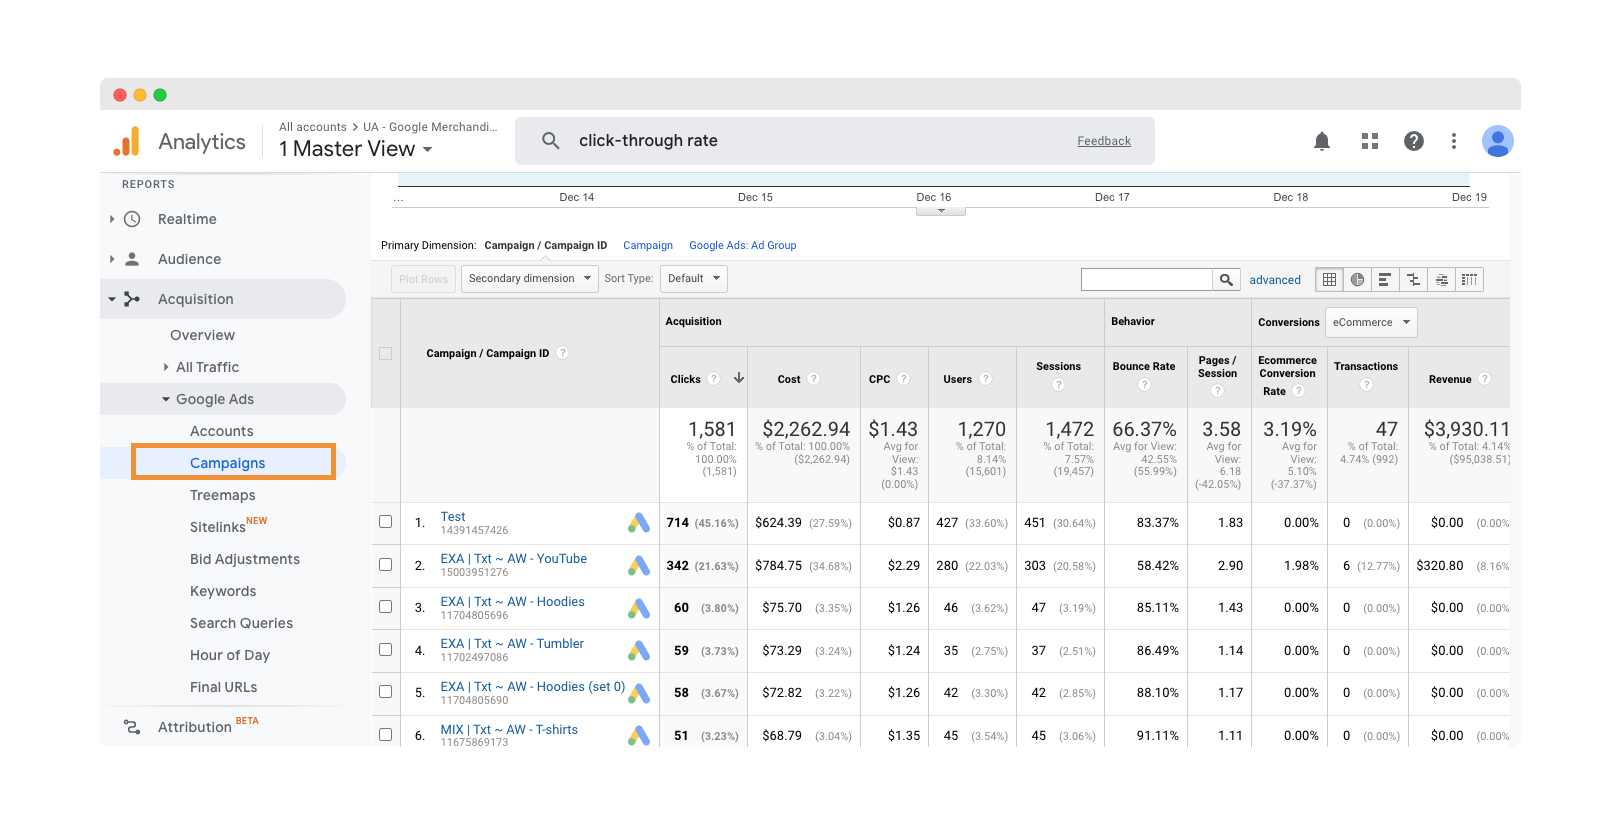
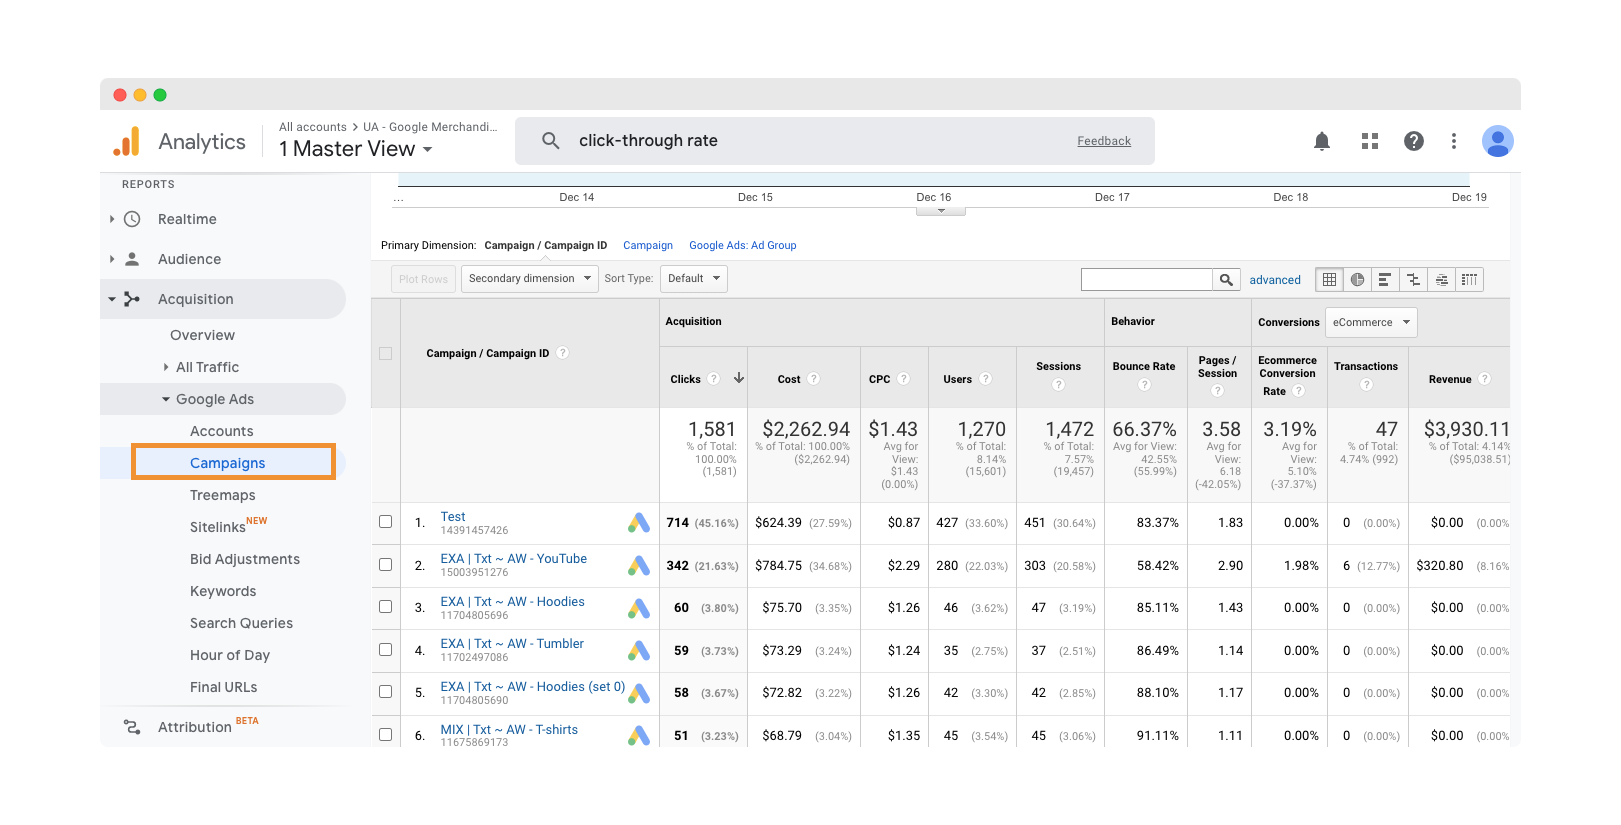
Check Acquisition ➞ Google Ads ➞ Campaigns and Acquisition ➞ Campaigns ➞ Cost Analysis to analyze how much money you have to spend on gaining a new buyer.
Marketing metrics
15. Traffic source
This metric measures how much traffic comes from different sources, such as organic searches, paid searches, and social media. Understanding where your website visitors are coming from is vital for targeting marketing efforts to the appropriate channels.
How to track it?
Check Acquisition ➞ All Traffic ➞ Channels to see where your visitors are coming from.
16. Customer engagement rate
This metric measures how well a business engages its current customers: the higher your engagement rate, the more likely your customers will complete their purchases.
How to track it?
Take a closer look at such things as:
- Click-through rates of email campaigns
- Number of subscribers to your blog or channel
- Number of leads generated from online advertising
17. The valid email collection rate
This is the percentage of valid email addresses a company collects in one campaign. The higher the proportion, the more effective that marketing campaign was at collecting email addresses, and the more likely it is that those addresses can be used in future campaigns.
How to track it?
The best way to track email marketing results is to have an email service provider like MailChimp provide you with a downloadable report.
18. Net Promoter Score (NPS)
This customer loyalty metric measures how likely customers are to recommend a company’s products or services to others.
NPS can gauge overall customer satisfaction with a company and the likelihood of clients purchasing again from that retailer.
How to track it?
Set up a 24/7 customer feedback channel integrated with Google Analytics or conduct customer surveys to determine how likely your customers are to recommend your products.
19. Social media engagement
It’s no secret that social media is a powerful tool for e-commerce businesses. Not only can social media help a business build brand awareness, but it can also help drive traffic to a company’s website.
There are many different ways to measure the success of a social media campaign, but one of the most important metrics is social media engagement. This estimates the number of interactions on a brand’s social media posts.
How to track it?
One of the most common ways to calculate social media engagement is to look at the number of likes, shares, and comments on your posts.
20. Revenue on advertising spent
This metric measures how much money a business brings in from its advertising efforts.
Understanding this metric can help you determine whether or not your advertising efforts are paying off and if the time and money you’re investing into those efforts will lead to future gains.
You should aim for a higher revenue number for a more significant amount spent on advertising.
How to track it?
Click Acquisition → Google Ads → Campaigns to see how much you spend on advertising.
Setting up tracking on your website in a nutshell
Tracking all these metrics might seem overwhelming, but some solutions can help you with that and reduce your efforts to a minimum.
One of these services is Luigi’s Box Analytics, which gives insights into your e-commerce performance. It has a simple, intuitive dashboard that provides fast, visual feedback. In addition, you get detailed content analysis to help you improve your e-commerce store and tailor it to meet the needs of 2024.
With all these metrics at your disposal, you can make the best decisions for your business and keep it going strong in 2024.
Barbora does magic with words in Luigi's Box as a product marketing specialist. She got into writing while studying at university as a volunteer for various civic associations. Besides being part of Luigi's Box marketing team, she co-organizes the TEDxBratislava conference, where she cares about marketing and PR.
More blog posts from this author